Kitsap County Quarterly Housing Market Update: Sep - Nov 2025
Welcome back to the Quarterly Kitsap Housing Market Update for September through November 2025, your go-to guide for what’s actually happening in our local real estate world. Every quarter, I break down how Kitsap is stacking up so you don’t have to wade through cryptic charts, outdated headlines, or that one neighbor who “swears the market is crashing.”
And buckle up, because this quarter served up a quiet-but-promising shift: interest rates have started to slip downward… even if only by a smidge. In real estate, even baby steps can feel like fresh air after holding your breath for too long.
Now let’s talk big-picture. Kitsap’s market remains strong, even with inventory creeping upward. More homes hitting the market might look like cooling, but don’t let the illusion fool you, we’re still well below what anyone would call a balanced or “normal” market. Translation? Sellers still hold the upper hand, and buyers are still actively out there looking for their next address.
If you noticed homes sticking around a little longer, you’re not wrong. But before you assume demand is fading, here’s the truth bomb: the listings lingering past 30 days are usually overpriced, under-prepped, or simply not presenting their Sunday best. Today’s buyers are sharp. The homes that shine and are priced correctly? Still getting attention and offers.
Kitsap continues to be competitive with steady demand. Even with rising inventory, this market is far from sluggish.
Sellers: prep it well and price it right, and you’ll attract serious buyers.
Buyers: stay sharp. Yes, some homes are lingering, but the true gems? Still moving quickly. And with interest rates inching down, the coming months may open even more doors, literally and figuratively, for everyone on the playing field.
Quarterly Kitsap County Housing Market Stats (Last 3 Months)
Data Range: Sept–Nov 2025
Previous Quarter for Comparison: May – Aug, 2025
This quarter’s Kitsap County Housing Market Stats paint a very different picture than the week-by-week shifts we’re all used to watching. Now that we’re looking at the last three months, the trends are clearer, calmer, and, honestly, more insightful.
Let’s start with the big shifts:
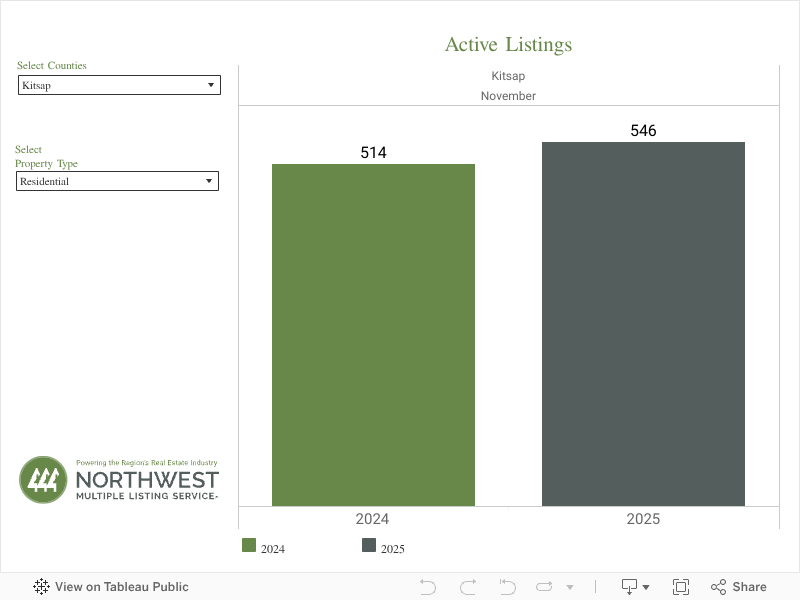
Active Listings:
Previous Quarter: 155
This Quarter: 244
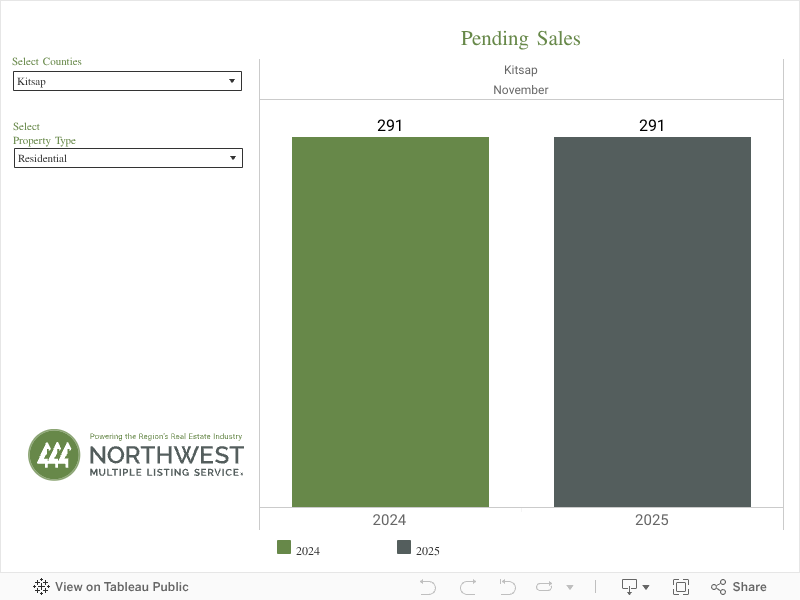
Kitsap saw a significant jump in active inventory, giving buyers more options and suggesting sellers are feeling confident enough to bring their homes to market.Pending & Pending Inspection:
Previous Quarter: 27
This Quarter: 281
Buyer activity surged this quarter, with a massive increase in homes going under contract. This tells us the demand is still very much alive.Sold Homes:
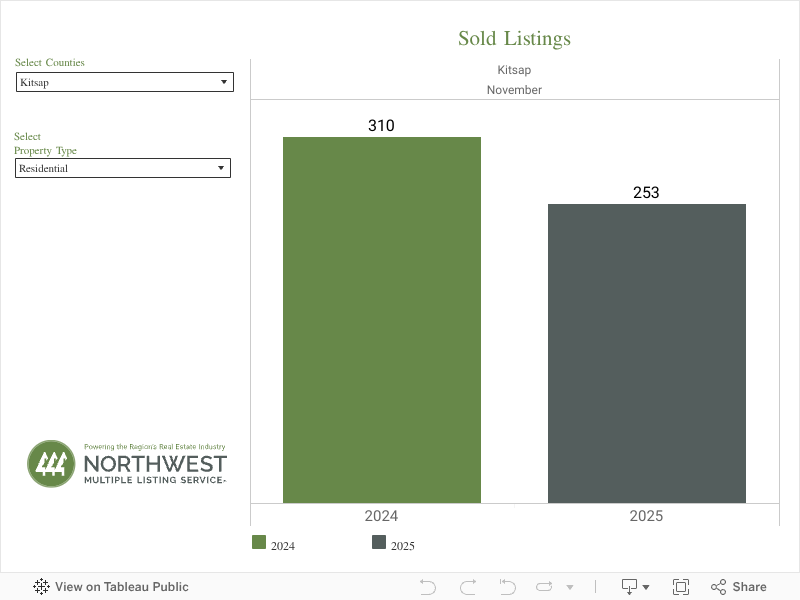
Previous Quarter: 1,111
This Quarter: 595
Closed sales dropped compared to the busy summer months, but don’t panic. This is a normal seasonal shift as we move into fall, when closings naturally taper off.Expired & Canceled Listings:
Previous Quarter: 204
This Quarter: 146
Fewer listings fell off the market, which is a positive sign that sellers may be aligning more realistically with market expectations.
What It All Means
Quarterly trends tell a more balanced story than watching the market week by week. While the summer quarter was hot in both temperature and sales volume, this fall has been more about rebalancing.
Inventory climbed. Pending sales rose dramatically. Sold numbers dropped because fewer buyers were writing offers at the beginning of the quarter, but they were definitely writing them as the months went on.
And here's the quiet hero of the season:
Interest rates have finally started inching down.
Not dramatically, but enough to nudge cautious buyers off the sidelines and back into the game.
Kitsap is still strong, still competitive, and still far from a slow market.
Sellers: The homes that are priced right and prepped well continue to move, quarter after quarter.
Buyers: With more inventory on the table and interest rates calming down, opportunities are opening up, slowly, but surely.
The market is adjusting, not weakening. Think of it as Kitsap taking a deep breath before the next push.
Kitsap County Stats: September - November 2025
Thinking about Selling your Home?
Fill in your address and I will send you a quick report showing an estimated value of your home
Pending Price Data
Pending sales data is one of the juiciest pieces of intel we now have access to inside the NWMLS and it’s something you simply can’t find anywhere else. Unlike closed sales, which are already in the rearview mirror, pending sales show you what’s happening right now. They’re a sneak peek into the market’s next moves, giving us a window into buyer demand, price trends, and how quickly homes are being scooped up. Think of it as reading tomorrow’s headlines today.
This matters because the real estate market doesn’t wait. By the time a sale closes and shows up in public stats, the market could have shifted. Pending sales data bridges that gap. It lets us see which price points are hot, how long it’s taking for homes to go under contract, and whether buyers are starting to pull back or charge full speed ahead. For sellers, that means smarter pricing and timing. For buyers, it means knowing exactly what kind of competition they’re up against.
And here’s the kicker, this level of insight is exclusive to NWMLS and.… ME! Zillow, Redfin, and all the big national sites? They don’t have it. That means when I’m pulling stats for you, we’re not playing with the same watered-down data everyone else is using. We’re tapping into information that actually reflects the pulse of the Kitsap market as it’s happening. In other words, when we talk strategy, we’re not guessing, we’re armed with facts that only licensed pros can see.
Median Pending Price
Average Pending Price to List Ratio (%)
Pendings with Multiple Offers (%)
When you look at the monthly stats, you’re really seeing the “big picture” story of our market and it’s not just Kitsap County in a bubble. I’ll be showing you a side-by-side comparison of Kitsap County versus the rest of the NWMLS, so you can see how our little corner stacks up against the broader region.
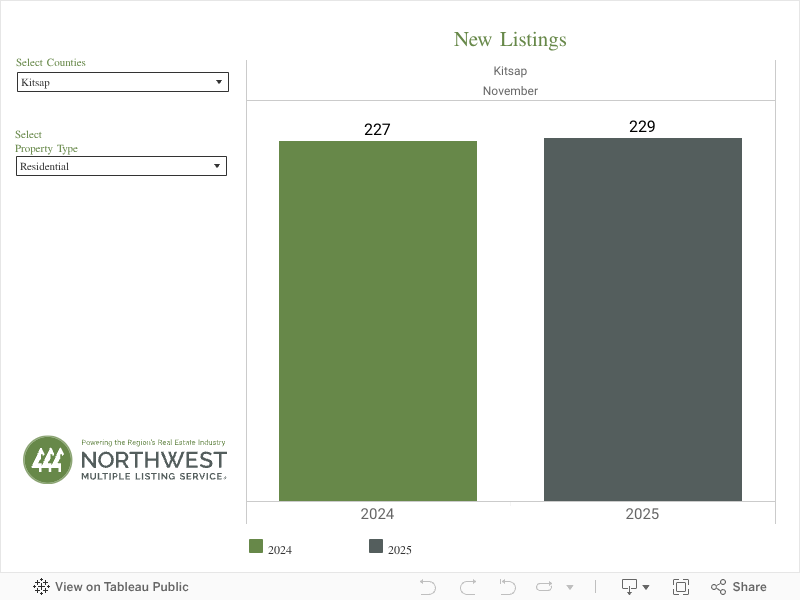
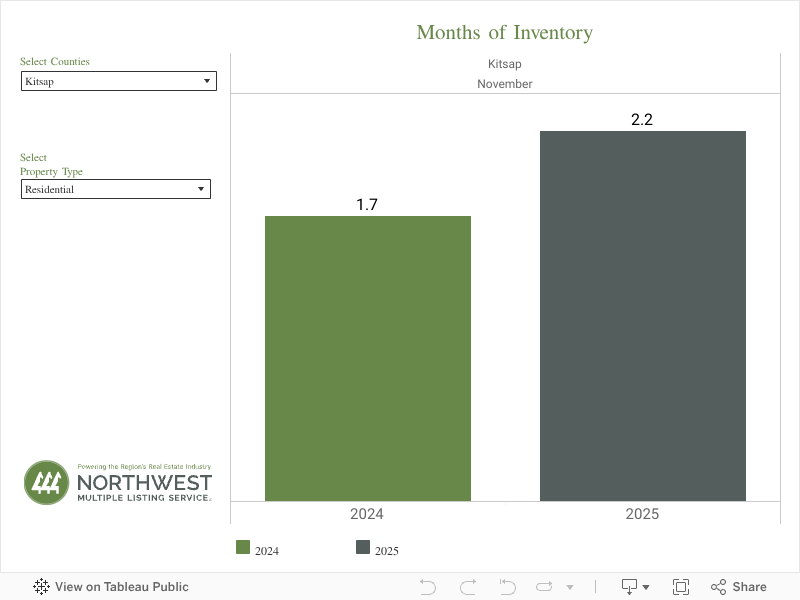
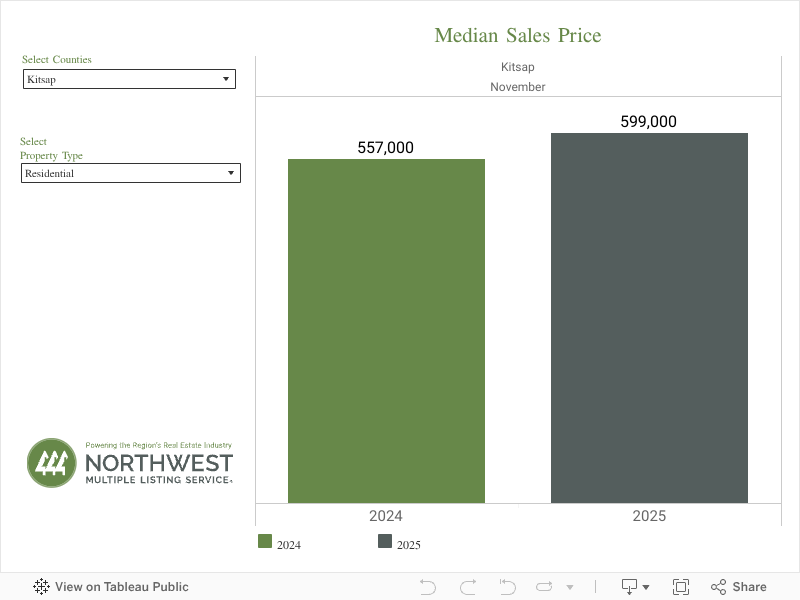
Here’s what those numbers mean: Active listings tell us how many homes are available right now, while new listings show how many fresh options just hit the market. Pending sales (the homes that went under contract) give us a clue about buyer activity in real time, and sold listings show how many deals officially crossed the finish line. Months of inventory measures how long it would take to sell every available home if no new ones popped up, aka, the “speedometer” of the market. And of course, the median sales price is the crowd favorite, showing the middle price point where half the homes sold for more and half sold for less.
The October 2025 stats are HERE!